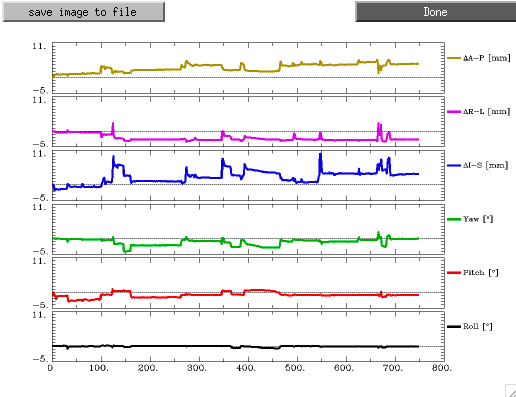
Plotting Motion Across an Imaging Run
Depending on how you obtained the motion.1D file associated with your imaging acquisition, there is sometimes additional info included in the file that you do not necessarily want to plot.
Below is a truncated example of a motion.1D file produced after running the CFMRI maintained topup wrapper scripts.
 vi motion.1D

 0   0.0000   0.0000   0.0000   0.0000   0.0000   0.0000            0           0
 1  -0.0017  -0.0343   0.0115   0.0210   0.0086   0.0162            0           0
 2  -0.0014  -0.0405   0.0169   0.0734   0.0142   0.0539            0           0
 3   0.0134  -0.1549   0.0230   0.0330  -0.0073   0.1231            0           0
 4   0.0838  -1.1889   0.0779  -0.8696  -0.2651   0.7913            0           0
 5   0.0866  -0.9654  -0.0148  -1.8105  -0.2472   0.7428            0           0
 6   0.0462  -1.0291   0.1606  -1.0828   0.0247   0.8405            0           0
 7   0.0641  -1.1105  -0.0844  -1.4806  -0.1765   0.8411            0           0
 8   0.0459  -2.2641  -0.1647  -1.2151  -0.2816   1.0741            0           0
 9   0.0706  -1.6061   0.0374  -1.3916  -0.3912   1.0837            0           0
10   0.0849  -1.3017   0.0324  -1.4102  -0.4322   1.0012            0           0
11   0.0800  -1.2537   0.0005  -1.3840  -0.4484   0.9795            0           0
12   0.0821  -1.2412  -0.0193  -1.4728  -0.4494   0.9665            0           0
13   0.0767  -1.2557  -0.0125  -1.4208  -0.4367   1.0178            0           0
14   0.0731  -1.1971  -0.0135  -1.4756  -0.4549   0.9748            0           0
15   0.0858  -1.1740  -0.0348  -1.4601  -0.4533   0.9562            0           0
16   0.0877  -1.1489  -0.0439  -1.4616  -0.4557   0.9591            0           0
17   0.0940  -1.1143  -0.1090  -1.4452  -0.4531   0.9615            0           0
In general, when you want to visually assess the motion of your subject throughout an imaging run, you are not interested in plotting colums 0, 7, or 8 (if the file format is similar to the example above).
Using the command:
1dplot -volreg motion.1D
produces an image that looks like this:

Fortunately, there is a simple method of removing the unwanted columns from the plot.
Using the command:
1dplot -volreg motion.1D'[1..6]
indicates to the 1dplot program that you only want to view columns 1-6.
The resulting plot is much more meaningful.
